Connection overview
This window identifies all enabled Connections and their current state. Connections not enabled in Settings | Connections are not listed.
The window may be pinned to the macOS desktop as a 'floating' window using the pin icon in the right-side of the title-bar when using macOS 15 or later.
An example of three connections is presented below:
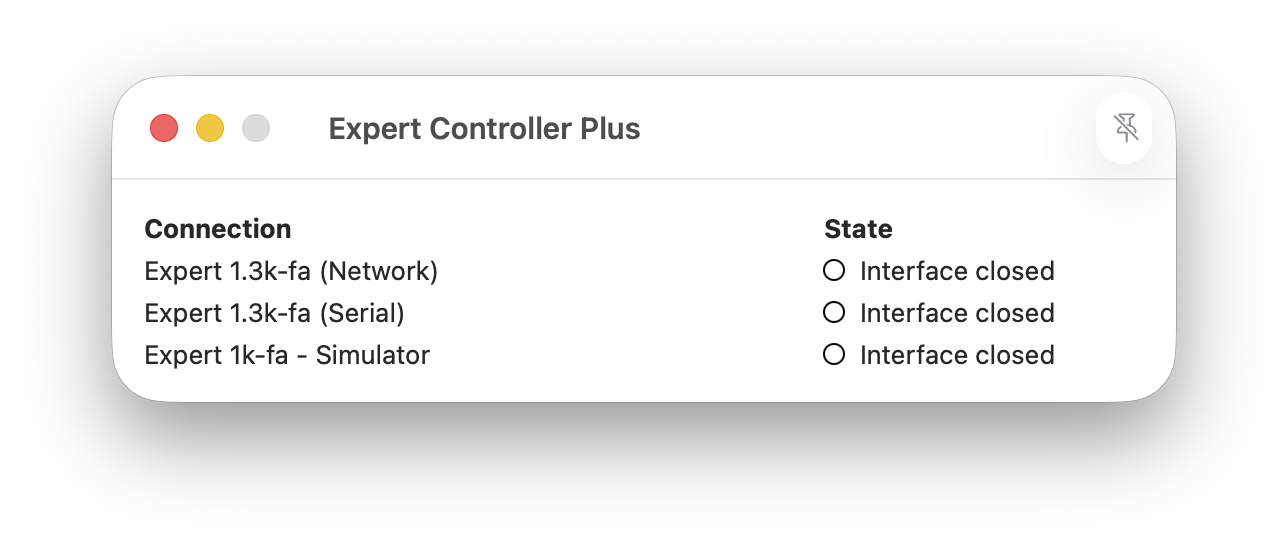
The 'Connection' column is the name specified in Settings for a Connection.
The 'State' column presents a coloured ball and label that describes the state of the Connection. For a description see Connection state
Statistical information
The Connection summary window can be modified to show the total messages sent to and received from an amplifier along with the timestamp of the last received message. This additional information may be enabled using the application-level setting 'Show statistical information'. An example is presented below:
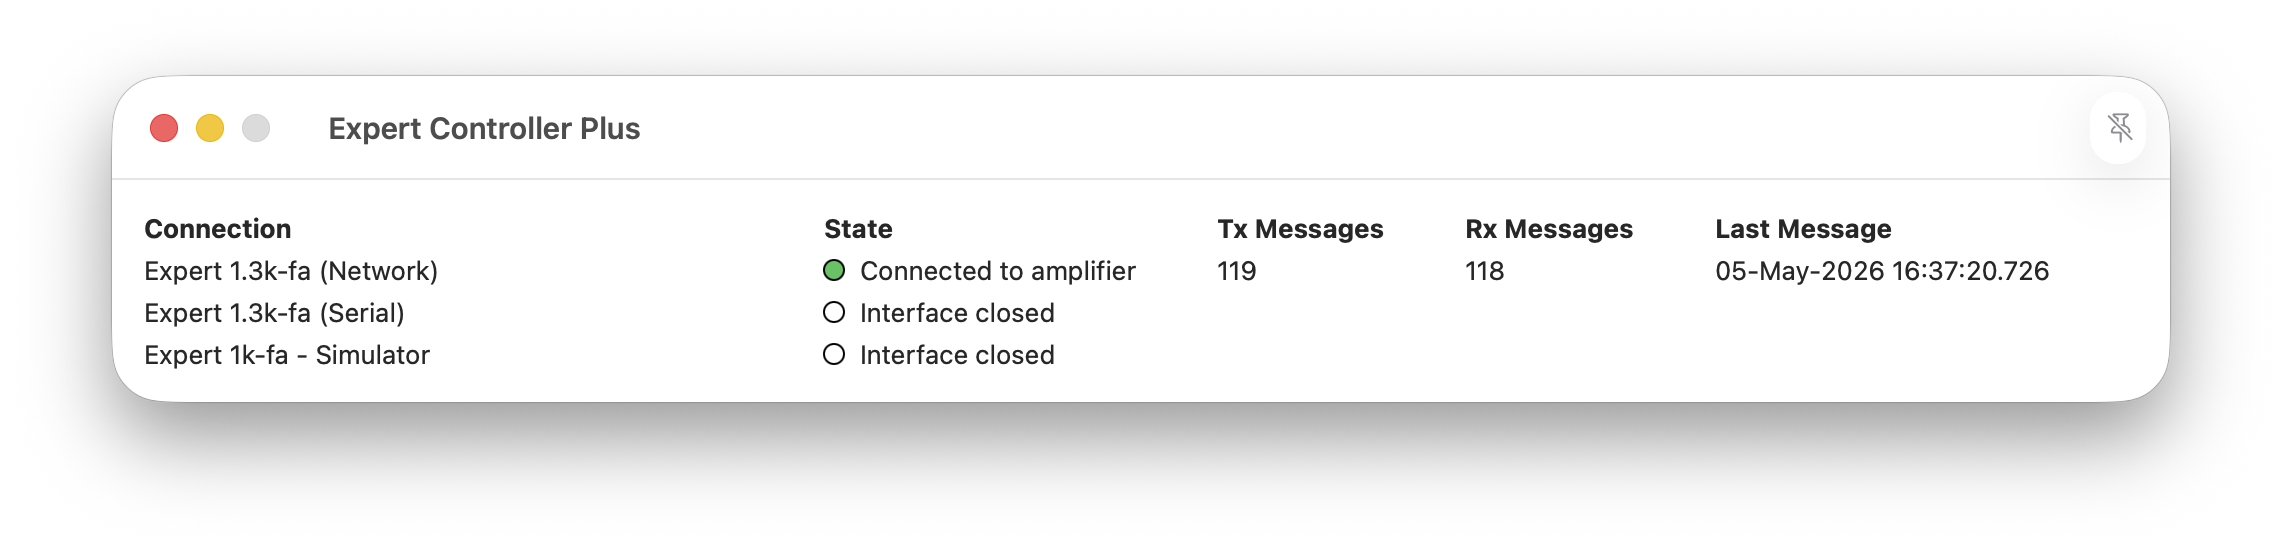
The display of statistical information may be useful when diagnosing communications issues for a Connection. It is recommended that this feature be disabled when not required as it consumes additional compute resources not necessary in day-to-day use.
In nominal conditions the number of Tx messages will be similar to the number of Rx messages. In a scenario where Expert Controller Plus had an active connection with an amplifier but the amplifier has ceased to respond - perhaps if it has been put to sleep, switched off or a cable disconnected - Expert Controller Plus will enter a Disconnected state but will continue to periodically attempt to re-establish communications. In such a scenario the Tx message count will increase and the Rx message count will be unchanged.